
The average Basildon home was worth £367,920 in September, the highest on record by £11. Castle Point has edged above the borough, and August was revised up.
The average home in Basildon borough was worth £367,920 in September. That is the highest figure the official index has recorded for the borough. It beats the previous peak, £367,909 in November 2022, by £11.
The figure comes from the Land Registry’s UK House Price Index, published on 18 November. Prices rose 0.8 per cent on the year and 0.1 per cent on the month.
An £11 record is a fragile one. The latest months are revised as late sales are registered, and a small revision could move September back below the 2022 peak.
Every type of home rose in the month
All four types of home were worth more on average than in August. Detached houses are now rising on the year again, after the revised figures put August back in positive territory.
| Type | September 2026 | Change on year | Index (Jan 2023 = 100) |
|---|---|---|---|
| Detached | £678,499 | +0.5% | 99.5 |
| Semi-detached | £429,326 | +1.7% | 102.0 |
| Terraced | £319,947 | +1.4% | 101.9 |
| Flat or maisonette | £189,146 | -1.6% | 94.9 |
Flats are still the one type falling over the year. A Basildon flat is worth about 5 per cent less than in January 2023, the index’s base month.
Semi-detached houses have done best. Their index stands at 102.0, so the average semi is about 2 per cent above its January 2023 level.
A first-time buyer paid an average of £307,721, up 1.0 per cent on the year.
Castle Point edges above Basildon
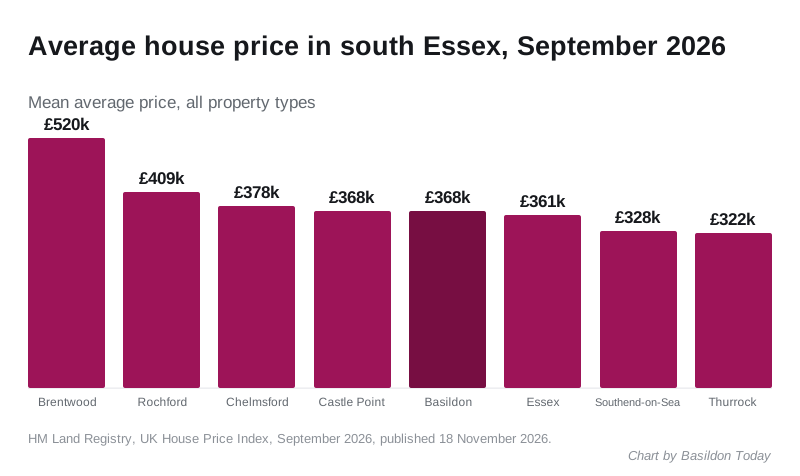
| District | September 2026 average | Change on year | Change on month |
|---|---|---|---|
| Brentwood | £520,447 | +0.2% | +0.1% |
| Rochford | £408,883 | +1.3% | 0.0% |
| Chelmsford | £378,412 | -0.8% | +0.1% |
| Castle Point | £368,191 | -0.7% | +2.5% |
| Basildon | £367,920 | +0.8% | +0.1% |
| Southend-on-Sea | £327,570 | +1.8% | +0.9% |
| Thurrock | £322,338 | -0.7% | +0.3% |
| Essex | £360,791 | +0.5% | +0.2% |
| England | £292,998 | +0.8% | -0.4% |
Castle Point, next door, is now £271 dearer than Basildon on average. A month ago it was about £8,000 cheaper. Its average jumped 2.5 per cent in a single month, which is a large move for the index and may well be revised.
Basildon matched England’s annual rise of 0.8 per cent and beat Essex, which rose 0.5 per cent. Southend-on-Sea had the strongest year in the group, up 1.8 per cent.
August has been revised up
Our August report said the average Basildon home was worth £366,218, up 0.4 per cent on the year. The Land Registry has since revised August to £367,401, a rise of 0.7 per cent.
The revision also changes our August headline about detached houses. We reported them at £672,752, down 0.3 per cent. The revised figure is £677,429, up 0.4 per cent. The August article now carries a correction.
What it means for you
UKHPI is a mean average, not a median, so a few large sales can pull it up or down. It is a modelled index, and recent months move as late sales are registered. Read it as the direction of travel, not a valuation of your home.
For owners, the index says the borough has only now climbed back to where it stood in late 2022. Almost four years on, the average Basildon home is worth about the same in cash terms.
For buyers, flats remain the part of the market where prices have given ground. What homes actually sold for, street by street, is on our Basildon house prices by postcode page.
Sources
- HM Land Registry, UK House Price Index, Basildon, September 2026 release, published 18 November 2026, contains HM Land Registry data (c) Crown copyright, Open Government Licence v3.0 (https://www.nationalarchives.gov.uk/doc/open-government-licence/version/3/)
- HM Land Registry, UK House Price Index for Essex, England, Brentwood, Chelmsford, Castle Point, Rochford, Southend-on-Sea and Thurrock, September 2026
- HM Land Registry, UK House Price Index, Basildon, monthly averages January 2021 to September 2026 (previous peak £367,909, November 2022)
Have your say