
Basildon's average home was £366,218 in August, up 0.4%. Detached homes have now joined flats in falling, and July's figure has been revised down to £365,861.
The average home in Basildon borough was worth £366,218 in August. That is up £1,302, or 0.4 per cent, on August 2025. The figure comes from the Land Registry’s UK House Price Index, published on 21 October.
The borough is level with England, which also rose 0.4 per cent. Essex as a whole fell 0.3 per cent.
The change this month is in detached homes. A month ago they were still just above their level of a year earlier. Now they are falling too.
Detached homes join flats in falling
A detached house in the borough averaged £672,752 in August, down 0.3 per cent on the year. Against January 2023, the base month the index uses, it is £9,484 lower. When we reported July’s first figures, that gap was £5,619.
Flats are still the weakest part of the market. A Basildon flat averaged £188,968, down 2.0 per cent on the year and £10,246 below January 2023.
Semis and terraces are holding the average up:
| Type | August 2026 | Change on year | Change since Jan 2023 | Index (Jan 2023 = 100) |
|---|---|---|---|---|
| Detached | £672,752 | -0.3% | -£9,484 | 98.6 |
| Semi-detached | £427,038 | +1.2% | +£6,135 | 101.5 |
| Terraced | £319,089 | +1.3% | +£5,038 | 101.6 |
| Flat or maisonette | £188,968 | -2.0% | -£10,246 | 94.9 |
Taken together, the borough’s index stood at 99.8. The average Basildon home is £601 below its January 2023 level of £366,819.
A first-time buyer paid an average of £306,407 in August. That is up 0.5 per cent on the year and almost exactly where it was in January 2023.
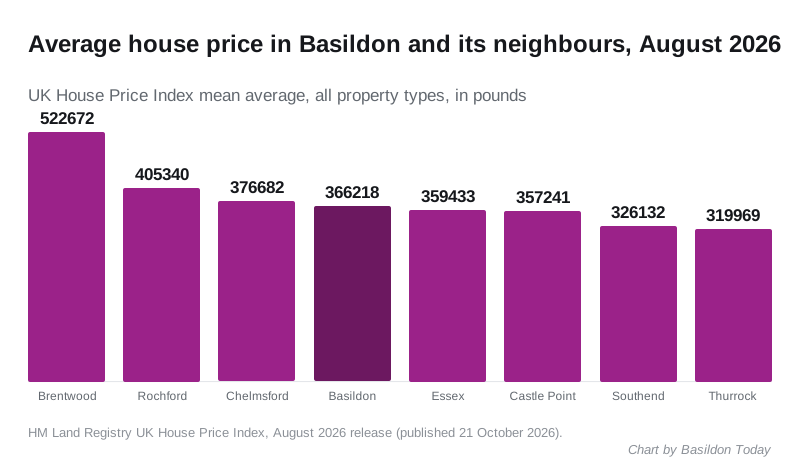
How Basildon compares with its neighbours
| District | August 2026 average | Annual change |
|---|---|---|
| Brentwood | £522,672 | +0.3% |
| Rochford | £405,340 | +0.5% |
| Chelmsford | £376,682 | -2.4% |
| Basildon | £366,218 | +0.4% |
| Castle Point | £357,241 | -4.0% |
| Southend-on-Sea | £326,132 | 0.0% |
| Thurrock | £319,969 | -1.4% |
| Essex | £359,433 | -0.3% |
Castle Point, next door, is again the weakest of the group. Its average fell 4.0 per cent, and its flats fell 7.8 per cent to £163,826. Chelmsford fell 2.4 per cent.
Brentwood shows how much these figures move after publication. Last month the index put Brentwood’s July change at -2.4 per cent. The revised July figure is -1.7 per cent, and August is up 0.3 per cent.
July has been revised down
Our July report said the average Basildon home was worth £367,233, up 0.6 per cent on the year. The Land Registry has since revised July to £365,861, a rise of 0.2 per cent. The July article now carries a note.
What it means for you
UKHPI is a mean average, not a median, so a few large sales can pull it up or down. It is a modelled index, and the most recent months are revised as late sales are registered. Read it as the direction of travel, not a valuation of your home.
If you own a detached house or a flat in the borough, the index says your type of home is worth less on average than at the start of 2023. Semis and terraces have gained about 1.5 per cent over the same period.
For buyers, those are the two parts of the market where prices have given ground. Council tax on any home is set by its band, not its price: see our Basildon council tax bands page. The running Basildon house prices page is updated with each release.
Sources
- HM Land Registry, UK House Price Index, Basildon, August 2026 release, contains HM Land Registry data (c) Crown copyright, Open Government Licence v3.0
- HM Land Registry, UK House Price Index for Essex, England, Brentwood, Chelmsford, Castle Point, Rochford, Southend-on-Sea and Thurrock, August 2026
Have your say