
Basildon's average hit £367,233 in July, up 0.6% while Essex fell. But flats are worth £10,307 less than in January 2023, and detached homes are down too.
Basildon borough was one of the few corners of Essex where house prices rose in the year to July. The average home reached £367,233, up £2,281 or 0.6 per cent on July 2025, according to the Land Registry’s UK House Price Index. Essex as a whole fell 0.3 per cent over the same year.
The more revealing number is the one the index itself hands you. UKHPI sets January 2023 as its base of 100, and in July 2026 Basildon’s index stood at 100.1. In three and a half years, the average Basildon home has gained £414.
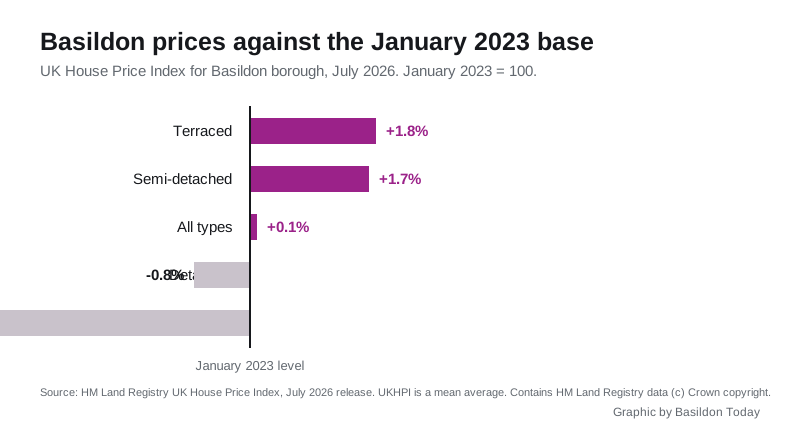
Underneath that flat line, the four property types have pulled apart sharply. Measured against the same January 2023 base, terraced homes are up 1.8 per cent and semi-detached homes 1.7 per cent, while detached homes are down 0.8 per cent and flats down 5.2 per cent.
Flats are carrying the losses
A Basildon flat averaged £188,907 in July, down 2.2 per cent on the year and the only one of the four types to fall. Set against the January 2023 base it is worse: flats then averaged £199,214, so the typical flat in the borough is £10,307 cheaper than it was three and a half years ago, an index reading of 94.8.
Detached homes have quietly done the same thing more slowly. At £676,617 they are up 0.1 per cent on the year, but £5,619 below the January 2023 average of £682,236.
The two types in the middle are the ones holding the borough’s average up:
| Type | July 2026 | Change on year | Change since Jan 2023 | Index (Jan 2023 = 100) |
|---|---|---|---|---|
| Detached | £676,617 | +0.1% | -£5,619 | 99.2 |
| Semi-detached | £428,151 | +1.6% | +£7,248 | 101.7 |
| Terraced | £319,861 | +1.6% | +£5,810 | 101.8 |
| Flat or maisonette | £188,907 | -2.2% | -£10,307 | 94.8 |
A first-time buyer in the borough paid an average of £307,295 in July, up 0.8 per cent on the year and £910 more than in January 2023.
How Basildon compares with its neighbours
Basildon’s 0.6 per cent rise looks modest until you put it next to the rest of south Essex. Three of the five districts around it fell over the year, and two of them fell hard.
| District | July 2026 average | Annual change |
|---|---|---|
| Brentwood | £514,480 | -2.4% |
| Rochford | £412,543 | +2.9% |
| Chelmsford | £378,080 | -2.3% |
| Basildon | £367,233 | +0.6% |
| Castle Point | £356,579 | -4.3% |
| Southend-on-Sea | £328,383 | +1.6% |
| Thurrock | £321,941 | -0.9% |
| Essex | £359,978 | -0.3% |
Castle Point next door had the steepest fall of the group at 4.3 per cent, and its flats dropped 7.7 per cent. Brentwood remains by far the most expensive place in the group, at roughly £147,000 above Basildon.
What it means for you
UKHPI is a mean average, not a median, so a handful of large sales in a month pulls it up. It is also a modelled index rather than a simple list of sale prices, which is why the figures get revised for several months after first publication. Read it as the direction of travel for the borough, not as a valuation of your street.
If you own a flat in the borough, the number that matters is not the 2.2 per cent annual fall but the 5.2 per cent gap to January 2023. A flat bought at the start of 2023 is, on these averages, still under water three and a half years later, before any of the buying and selling costs. Houses in the borough have not had that problem.
For buyers, the split works the other way. Flats and detached homes are the parts of the Basildon market where asking prices have had to give ground, and semis and terraces are where they have not.
Council tax on whatever you buy is set by the band, not the price. Our Basildon council tax bands page has the current charges, and the running Basildon house prices page is updated with each monthly release.
Correction to our June report. We reported in August that the average Basildon home was worth £360,294 in June, a fall of £3,612 on the year. The Land Registry has since revised that month up to £362,399, which makes the annual fall £1,507 rather than £3,612. The June article now carries a note to that effect.
Sources
- HM Land Registry, UK House Price Index, Basildon, July 2026 release, contains HM Land Registry data (c) Crown copyright, Open Government Licence v3.0
- HM Land Registry, UK House Price Index for Essex, Brentwood, Chelmsford, Castle Point, Rochford, Southend-on-Sea and Thurrock, July 2026
Have your say