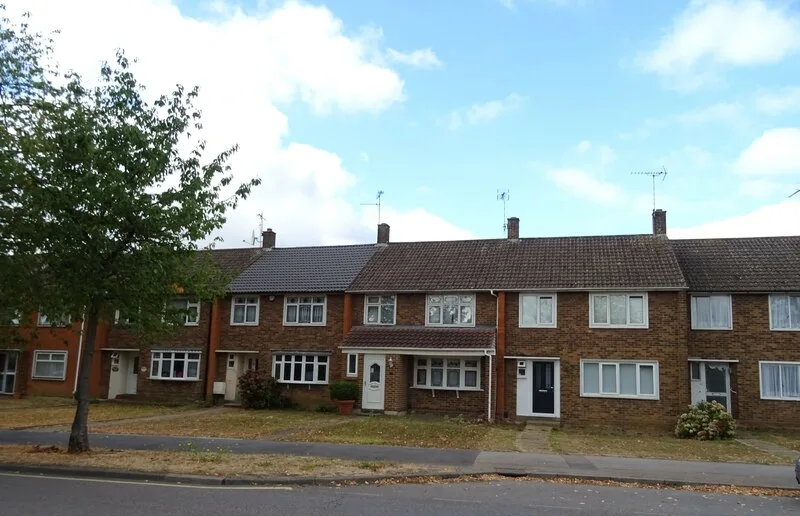

The middle Basildon home sold for £325,000 in the year to June 2026, against £480,000 in Billericay. Postcode by postcode, from Land Registry records.
Asking prices in agents’ windows are hopes. The number that counts is what homes actually change hands for, and every completed sale in England and Wales is recorded by HM Land Registry and published. This page reads those records for Basildon borough: the headline average, how it splits by property type, and what the middle home sold for in each postcode.
One thing to fix before the numbers. The official house price index is published for the whole Basildon borough, and that borough contains three places with very different markets. Basildon itself is a post-war new town of roughly 110,000 people. Billericay, at the northern end, is older, smaller and considerably more expensive. Wickford sits between them on its own railway line. The borough average sits somewhere in the middle and describes none of them. The second half of this page splits them.
The headline figure
The average home in Basildon borough sold for £360,294 in June 2026, the most recent month published in the UK House Price Index. That is down 1.0% over the year, though it is up 0.8% on the month, the borough’s biggest monthly rise since March 2025.
The annual fall is the part that stands out, because most of Essex is rising. Five of the twelve districts in Essex county fell over the year: Colchester by 0.3%, Basildon by 1.0%, Castle Point by 1.1%, Chelmsford by 1.2% and Brentwood by 1.6%. Rochford was up 6.2% and Epping Forest up 4.9%. Across Essex as a whole prices rose 1.2%, and across England 1.8%.
The borough is also still behind its own record. Basildon peaked at £367,909 in November 2022. Three and a half years later the average is £7,615, or 2.1%, below that peak in cash terms, and a good deal further below once inflation is allowed for. The full June breakdown, with every Essex authority ranked, is in our June 2026 house price report.
What it means for you
If you are buying, this is one of the few markets in the county where waiting has not cost you anything for a year. The useful lever here is geography: the gap between the cheapest and the dearest postcode below is £473,000, which is more than the price of most homes in the borough.
If you are selling, a 2022 price is optimistic and a Billericay comparable is not evidence for a Pitsea asking price. Flats are the weak spot, down 3.3% over the year and the fastest-falling category. Every property type did rise in June itself.
If you are staying put, your home is worth a little less in cash terms than it was last summer, and about 2.1% less than at the end of 2022.
Prices by property type
The average hides a wide spread. These are borough averages for June 2026 from the UK House Price Index, with the annual change alongside:
- Detached houses: £663,580, down 2.4%. The largest fall of any house type, and because detached homes pull the borough average up, most of the reason the headline dropped.
- Semi-detached houses: £420,370, down 0.2%. Essentially flat.
- Terraced houses: £313,485, up 0.3%. The only type up on the year, and the most common purchase in the borough by a wide margin.
- Flats and maisonettes: £185,783, down 3.3%. The cheapest way in and the fastest-falling category.
The same data splits buyers rather than buildings. A first-time buyer in the borough paid an average of £301,655 in June 2026, down 0.5%. A former owner occupier paid £452,355, down 1.5%. The £150,700 between those two figures is the size of the step from a first flat or terrace to a family house here.
What each part of the borough actually sells for
This is where the borough average stops being useful.
The table below is our own analysis of 2,262 residential sales in Basildon borough that completed between 1 July 2025 and 30 June 2026, taken from HM Land Registry Price Paid data and filtered to sales recorded in the Basildon district. It shows the median price, the middle sale, which is less distorted by one enormous house than an average is. The borough median over that period was £355,000.
A note on the postcodes. Basildon’s boundary does not follow postal districts, so SS11, SS16, CM11 and CM12 each straddle a neighbouring council. Only the sales recorded inside Basildon borough are counted here, which is why some outcodes show fewer sales than their whole postal area would.
| Postcode | Main places | Median sold price | Sales |
|---|---|---|---|
| CM12 | Billericay town, Little Burstead, South Green | £495,000 | 311 |
| CM11 | Billericay east, Ramsden Heath, Crays Hill | £465,000 | 204 |
| SS11 | Wickford north and the Runwell side | £390,000 | 179 |
| SS12 | Wickford town | £375,000 | 265 |
| SS16 | Vange, Langdon Hills, Kingswood, Lee Chapel South | £335,000 | 379 |
| SS15 | Laindon, Steeple View, Noak Bridge | £330,000 | 374 |
| SS14 | Basildon town centre, Fryerns, Barstable | £321,500 | 300 |
| SS13 | Pitsea, Bowers Gifford, Felmore | £300,000 | 244 |
Basildon, Billericay and Wickford, separately
Land Registry records a post town against every sale, which gives a cleaner split than postcodes do:
- Basildon: 1,297 sales at a median of £325,000. Well over half of everything sold in the borough.
- Billericay: 515 sales at a median of £480,000. £155,000 above Basildon.
- Wickford: 444 sales at a median of £380,000. Sitting between the two.
That £155,000 gap between Basildon and Billericay is the single most useful number on this page, and it is worth understanding why it exists.
Why Billericay costs more, and why it is not just the mix
The usual explanation for a low town median is the mix: new towns sell terraces and flats, older towns sell detached houses, and a median mixes them together. That is part of the story here. Terraced houses were 625 of Basildon’s 1,297 sales, and flats another 246. Between them, 67% of everything sold in Basildon was a terrace or a flat. Detached houses were 14%.
But the mix is not the whole answer. Compare like with like and Billericay is still dearer in every single category:
| Post town | Detached | Semi-detached | Terraced | Flat |
|---|---|---|---|---|
| Billericay | £697,500 | £467,000 | £377,500 | £236,500 |
| Wickford | £507,500 | £390,000 | £325,500 | £220,000 |
| Basildon | £511,500 | £382,500 | £325,000 | £181,000 |
| Whole borough | £570,000 | £410,000 | £325,000 | £195,000 |
A detached house in Billericay costs £186,000 more than the same category in Basildon. A semi costs £84,500 more, a terrace £52,500 more and a flat £55,500 more. That is a real premium on the same kind of building, not an artefact of counting.
The other line worth noting in that table is Wickford against Basildon. On detached houses, semis and terraces the two are within a few thousand pounds of each other. Wickford’s higher overall median comes almost entirely from what it sells rather than what it charges: it sells proportionally more houses and fewer flats.
Down to the postcode sector
Split the eight postcode districts into sectors and the range inside the borough runs from £272,000 to £745,000. These are the sectors with at least fifteen recorded sales in the year:
| Sector | Roughly | Median | Sales |
|---|---|---|---|
| CM11 1 | Billericay north east, Norsey Road and the lanes beyond | £745,000 | 57 |
| CM12 9 | Billericay west, Mountnessing Road, Western Road | £541,000 | 116 |
| CM12 0 | Billericay south and South Green | £450,000 | 195 |
| CM11 2 | Billericay east, Great Burstead, Ramsden | £436,500 | 147 |
| SS12 0 | Wickford east, Shotgate | £415,000 | 105 |
| SS11 7 | Wickford north west, Runwell edge | £411,250 | 50 |
| SS11 8 | Wickford north, Nevendon | £380,000 | 129 |
| SS13 2 | Bowers Gifford and the Pitsea fringe | £380,000 | 52 |
| SS16 6 | Langdon Hills, Dry Street | £377,500 | 128 |
| SS15 4 | Noak Bridge, Steeple View | £375,000 | 76 |
| SS12 9 | Wickford town and west | £360,000 | 160 |
| SS14 3 | Fryerns, Cranes Farm Road side | £353,500 | 70 |
| SS16 5 | Kingswood, Lee Chapel South | £353,000 | 145 |
| SS15 6 | Laindon east, Laindon Common | £342,000 | 135 |
| SS14 2 | Barstable, Vange Road side | £320,000 | 137 |
| SS15 5 | Laindon west and Lee Chapel North | £315,000 | 163 |
| SS14 1 | Basildon town centre and Craylands | £305,000 | 93 |
| SS16 4 | Vange | £297,500 | 106 |
| SS13 3 | Pitsea east, Chalvedon | £285,000 | 82 |
| SS13 1 | Pitsea and Felmore | £272,000 | 110 |
On individual streets with at least six recorded sales in the year, the highest medians were Cranfield Park Road, Wickford (£1,080,000) and Western Road, Billericay (£872,000). At the other end, Durham Road in Basildon came in at £90,800 across seven sales, with Chestnut Road at £136,750 and Cherrydown East at £137,500, all flat-heavy addresses.
How Basildon compares
| Area | Average price | Annual change |
|---|---|---|
| Brentwood | £513,537 | −1.6% |
| Chelmsford | £383,103 | −1.2% |
| Essex county | £361,268 | +1.2% |
| Basildon borough | £360,294 | −1.0% |
| East of England | £338,707 | +1.1% |
| Thurrock | £327,176 | +2.3% |
| Southend-on-Sea | £325,586 | +3.7% |
| England | £293,262 | +1.8% |
Basildon sits within £974 of the Essex county average, which makes it look thoroughly typical. It is not. The borough figure is an average of Billericay at £495,000 and Pitsea at £300,000, and the direction of travel is the opposite of its neighbours’: Southend and Thurrock, the two places most Basildon workers commute to or from, both rose while Basildon fell.
None of that means homes here are cheap in the way they once were. The council’s own Local Plan consultation material records that in 1998, when Basildon’s current Local Plan was adopted, the average home in the borough cost 3.57 times the average local wage. It now costs 10.27 times.
Frequently asked questions
What is the average house price in Basildon?
The official index covers the whole borough, where the average home sold for £360,294 in June 2026, down 1.0% over the year. On completed sales in the year to June 2026, the median for the Basildon post town was £325,000, against £480,000 in Billericay and £380,000 in Wickford.
Are Basildon house prices going up or down?
Both, depending on the window. Prices fell 1.0% in the year to June 2026, one of five Essex districts to fall, at a time when Essex as a whole rose 1.2% and England rose 1.8%. But June itself was up 0.8%, the borough’s biggest monthly rise since March 2025. The borough average is still 2.1% below its November 2022 peak of £367,909.
Why is Billericay more expensive than Basildon?
Both the mix and the price. Basildon sells far more terraces and flats, which pulls a median down: 67% of its sales were one or the other. But Billericay is also dearer like for like. A detached house in Billericay had a median of £697,500 against £511,500 in Basildon, and the same premium holds for semis, terraces and flats.
Which part of Basildon borough is cheapest?
SS13 1, covering Pitsea and Felmore, at a median of £272,000 across 110 sales. The dearest sector is CM11 1 north east of Billericay at £745,000. Within the built-up new town, SS14 3 around Fryerns leads at £353,500.
How much is a flat in Basildon?
The borough average for a flat or maisonette was £185,783 in June 2026, down 3.3% over the year, the fastest-falling category. On completed sales, the median flat in the Basildon post town was £181,000, against £220,000 in Wickford and £236,500 in Billericay.
Where can I check what a specific house sold for?
Every completed sale in England and Wales is public. Search a street or address for free on the HM Land Registry Price Paid service.
Related
- Basildon trains to London and what a season ticket costs, which is the other half of the cost of living here, and the reason Billericay and Wickford commuters pay more than Basildon ones.
- Basildon planning news: the 26,909 homes the borough is now required to plan for, and the government order that follows 27 years without a Local Plan.
- Basildon roadworks, parking and travel.
Sources
- UK House Price Index, Basildon (ONS and HM Land Registry) for the borough average, property-type and buyer-type figures and the annual changes.
- HM Land Registry UKHPI open data for the June 2026 record, and the matching Essex, Brentwood, Chelmsford, Thurrock, Southend-on-Sea, East of England and England comparisons. The November 2022 peak comes from the same series.
- HM Land Registry Price Paid data for the postcode, sector, street, post-town and property-type medians, computed from 2,262 residential sales recorded in the Basildon district completing between 1 July 2025 and 30 June 2026.
- Basildon Borough Local Plan 2023-2043 Regulation 18 Part 3 Frequently Asked Questions (Basildon Borough Council) for the 1998 and current wage multiples.
Land Registry figures are provisional and revised as more sales are registered. Confirm the latest numbers against the linked sources before making a decision.
Have your say