
Basildon's claimant count rose 95 in August to 4,640, the most of any Essex district. St Martin's ward is on 6.6 per cent, Billericay East on 1.8.
The number of people in Basildon borough claiming benefits principally because they are out of work rose to 4,640 in August, up 95 on July and up 65 on the same month last year.
That is 3.9 per cent of residents aged 16 to 64, and it is the largest claimant count of any district in Essex. The figures were released by the Office for National Statistics on Tuesday 15 September (ONS claimant count via nomis).
The borough figure has barely moved for two years. It was 4,675 in August 2024 and 4,575 in August 2025. What the single borough number hides is how unevenly those claims are spread.
The ward gap is three and a half times
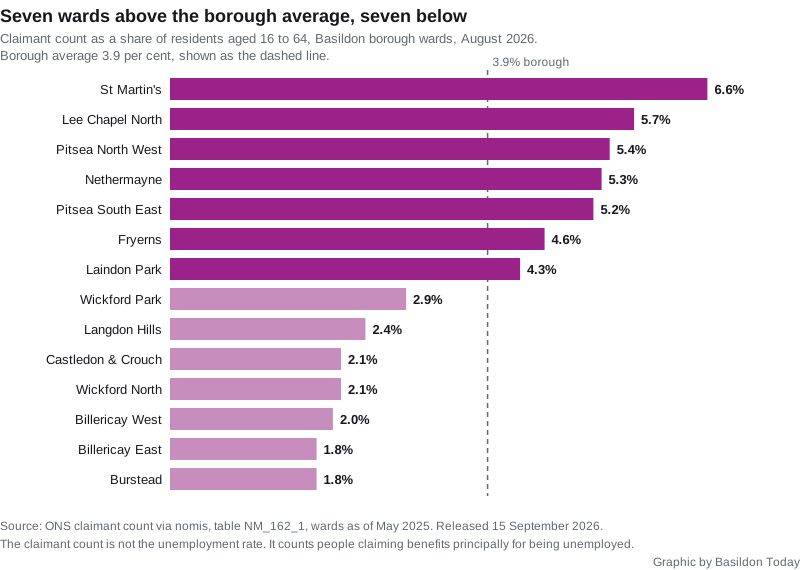
Break the borough down by its 14 wards and the range is stark. St Martin’s, which covers the town centre, is on 6.6 per cent. Billericay East and Burstead are both on 1.8 per cent.
| Ward | Claimants | Share of 16 to 64s | Change since January |
|---|---|---|---|
| St Martin's | 625 | 6.6% | +50 |
| Lee Chapel North | 570 | 5.7% | +30 |
| Nethermayne | 550 | 5.3% | +35 |
| Pitsea South East | 450 | 5.2% | +20 |
| Fryerns | 450 | 4.6% | -15 |
| Pitsea North West | 445 | 5.4% | 0 |
| Laindon Park | 375 | 4.3% | +20 |
| Wickford Park | 230 | 2.9% | +5 |
| Langdon Hills | 220 | 2.4% | +40 |
| Wickford North | 170 | 2.1% | +15 |
| Burstead | 150 | 1.8% | -10 |
| Billericay West | 140 | 2.0% | +10 |
| Castledon and Crouch | 140 | 2.1% | +15 |
| Billericay East | 130 | 1.8% | +15 |
Two things are worth saying about that table. Every figure in the claimant count is rounded to the nearest five, which is why the wards add up to 4,645 rather than 4,640. And the ward series only runs back to January 2026, because these are the ward boundaries as they stood in May 2025, so there is no like-for-like ward figure for last summer.
The seven wards above the borough average are all in the new town: St Martin’s, Lee Chapel North, Nethermayne, Pitsea North West, Pitsea South East, Fryerns and Laindon Park. The seven below it are Billericay, Wickford, Burstead, Langdon Hills and Castledon. Langdon Hills has risen fastest since January, up 40 claimants, from 180 to 220.
Basildon has the most claimants in Essex, and the third highest rate
Basildon has more people on the claimant count than any of the other 11 districts in Essex. Colchester is next with 4,005 and Tendring third with 3,485.
On the rate, Basildon is third. Harlow is on 4.6 per cent and Tendring on 4.1 per cent, and then Basildon on 3.9. At the other end, Uttlesford is on 2.0 per cent and Rochford on 2.3 (ONS claimant count by district).
For context, Essex as a whole is on 3.1 per cent and the East of England on 3.3. England is on 4.0 per cent and the United Kingdom on 3.9, so Basildon sits almost exactly on the national figure while sitting well above its own county.
The rise is concentrated among the under 25s
The borough’s year-on-year increase of 65 is not spread evenly across the age groups. Set August 2026 against August 2025:
- Aged 16 to 24: 1,035, up from 955. An increase of 80, or 8.4 per cent.
- Aged 25 to 49: 2,640, down from 2,675. A fall of 35.
- Aged 50 and over: 965, up from 940. An increase of 25.
So the whole of the borough’s rise, and more, is among people under 25. They now make up 22 per cent of everyone on the count in Basildon. The ONS does not publish a rate for individual age bands at district level, so these are counts rather than percentages.
By sex, 2,465 of August’s claimants were men and 2,180 were women. Both of those are rounded to the nearest five as well, which is why they come to five more than the borough total.
What it means for you
- If you are claiming, the ward figures are the ones to look at, not the borough figure. In St Martin’s, roughly one working-age resident in 15 is on the count. In Billericay East and Burstead it is closer to one in 55.
- This is not the unemployment rate, and it should not be quoted as one. See below.
- The next monthly release, covering September, is due in October. The ONS revises earlier months each time it publishes, so a figure quoted a month ago will not always match the one here. July now reads 4,545.
- Basildon Council runs its employment, training and skills support through Pathways.
What the claimant count actually measures
This is the number that gets misquoted most often in local coverage, so it is worth being precise. The ONS says the claimant count “is a measure of the number of people claiming benefits principally for the reason of being unemployed, based on administrative data from the benefits system”, and that it “does not attempt to measure unemployment, which is a concept defined by the International Labour Organisation (ILO) as all those who are out of work, actively seeking work and available to start work” (ONS, Claimant Count Quality and Methodology Information).
Since November 2016 it has also included people on Universal Credit who are required to look for work as a condition of their claim. That includes some people who are already working part time on very low earnings. So the 4,640 is not 4,640 people with no job at all.
Sources
- ONS claimant count, Basildon borough, 26-month series, table NM_162_1 on nomis, for the monthly counts back to July 2024.
- ONS claimant count rate, Basildon borough for the share of 16 to 64 year olds.
- ONS claimant count, all 12 Essex districts for the ranking by count and by rate.
- ONS claimant count by Basildon ward for the 14-ward table, wards as of May 2025.
- nomis dataset overview for NM_162_1, which records the August 2026 figures as last updated at 07:00 on 15 September 2026.
- ONS, Claimant Count Quality and Methodology Information for what the count does and does not measure.
Related
- Basildon house prices: what homes in the borough actually sell for, by type and by area.
- Basildon council tax bands: what each band costs this year.
- Basildon planning news: the Local Plan the government has ordered to consultation.
Have your say